First steps
This tutorial takes you through a first session with a project. At the end the project has an exploration and an index, you have followed a function through the call graph, asked the AI about it, and recorded what you learned in a projectdocs entry that is anchored to the function.
The examples use Weatherreport, a small Tauri app with a Rust backend and a
React frontend. The function parse_current reads the response of the
OpenWeather API. With your own project, pick any function you want to
understand and use its name instead.
Prerequisites: Tracemoor is installed, and the project is a folder on this machine in one of the supported languages. Step 5 needs an AI provider, see Set up a provider. All other steps work without one.
1. Create the exploration
- On the welcome screen, click + New Exploration….
- Keep Local folder selected.
- Under Source project, click Browse… and choose the project folder.
- Click Create.
If Git has no user name and email configured, Tracemoor asks for them first. The exploration opens on Review before analyzing.
Create and open an exploration describes the other fields and cloning from GitHub or Bitbucket.
2. Analyze the project
- On Review before analyzing, read Suggested exclusions and tick the folders that do not belong in the index, for example test fixtures.
- Click Analyze.
When the analysis has finished, the status bar shows the number of files, symbols and edges in the index. See Run the first analysis.
3. Follow a function in the graph
- Choose View › Graph View (
Cmd+6, Windows/Linux:Ctrl+6). - In the query bar, enter
call tree of parse_currentand pressEnter. - Weatherreport has two functions named
parse_current, one per weather provider. In the dialog 2 symbols called "parse_current" — which one?, click the one insrc/providers/openweather.rs.
The graph shows parse_current in the middle, its callers above and the
function it calls below.
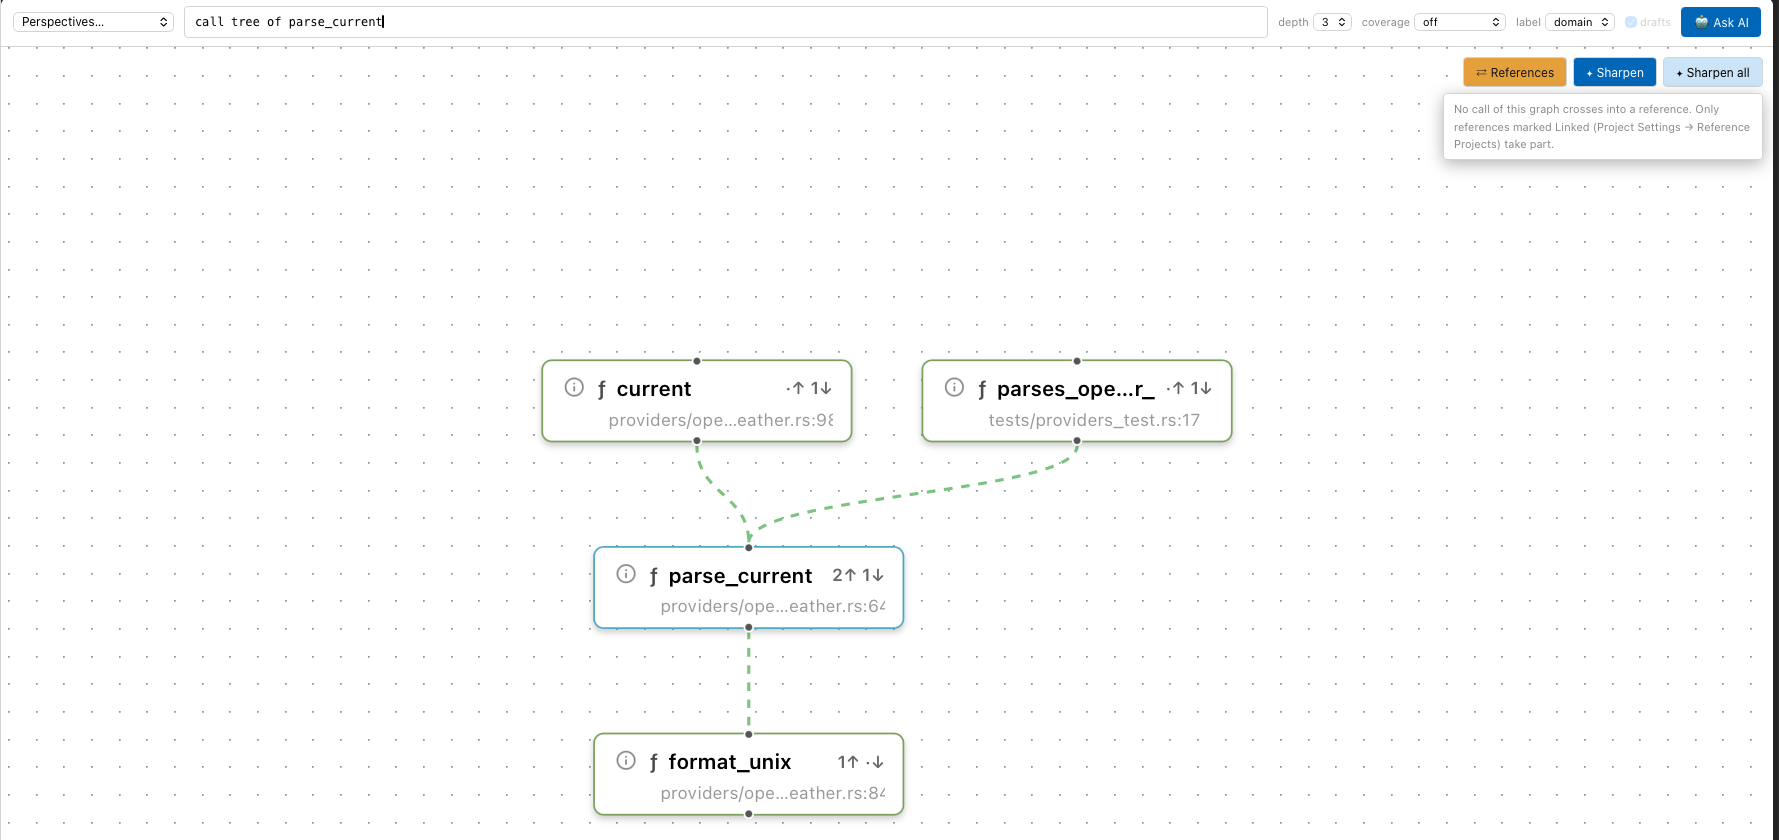
parse_current is called by current and by the test parses_openweather_current, and calls format_unix.
2↑ 1↓ on the node counts its incoming and outgoing edges. A double-click
on another node continues with the call tree of that node. See
Graph View and
Perspectives and queries.
4. Open the code
- On the
parse_currentnode, click ⓘ. The inspector card lists callers and callees. - Click Open in Editor. The editor opens next to the graph at the function.
- Choose View › Source View (
Cmd+3, Windows/Linux:Ctrl+3) for the file tree, the editor and the Details panel. - In the Details panel under Symbols, click
parse_current.
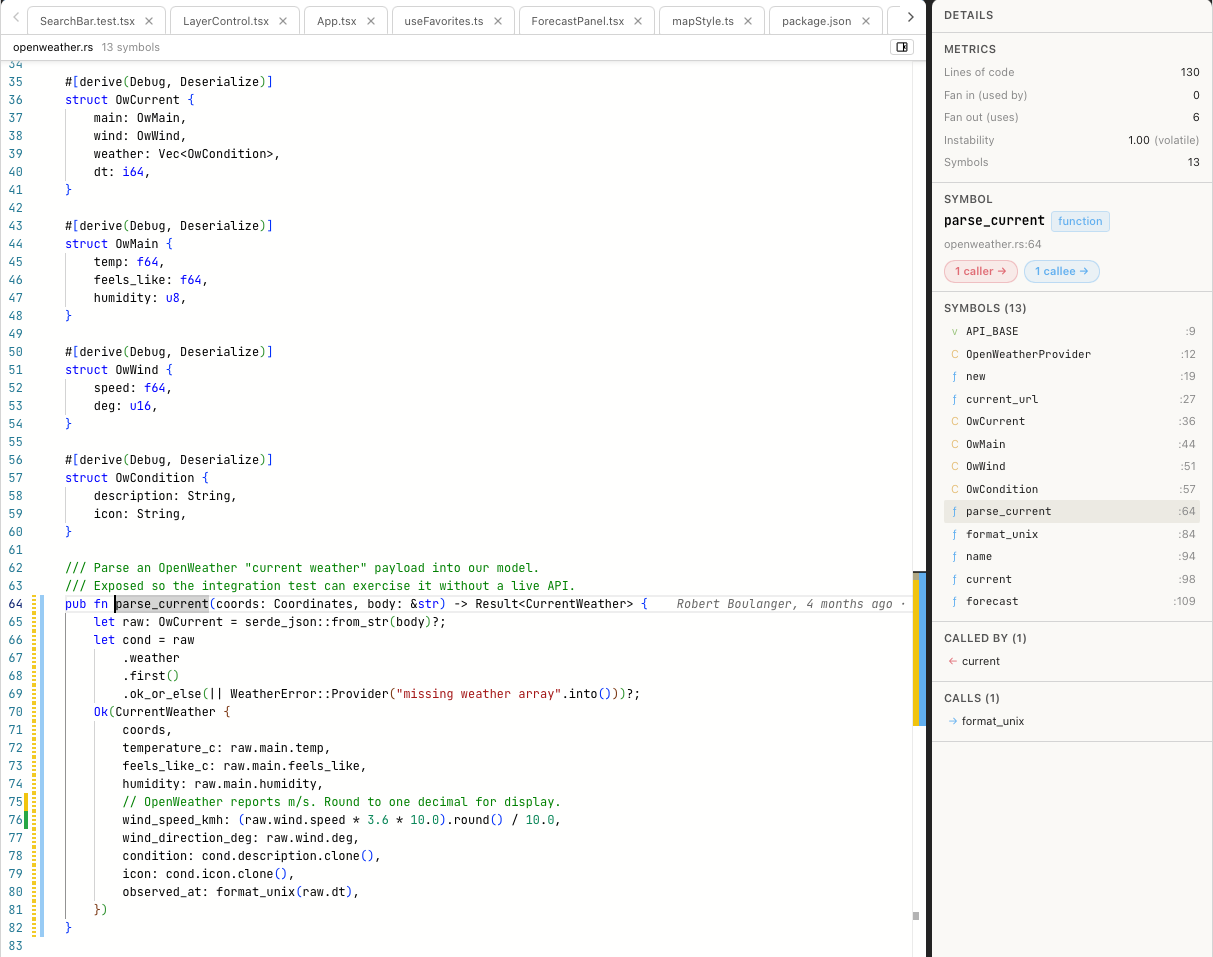
The Details panel shows the selected symbol with its callers and callees. The marks left of the code show specs, projectdocs and Git changes.
5. Ask the AI
- In the editor, right-click the line
pub fn parse_current(…)and choose Ask AI about this line…. - Under Your question, enter "Who calls this function, and where does its result end up in the app?"
- Click Ask. The question appears in the input field of the chat panel, with the file and line as context.
- Press
Enterto send it. With Send on Ctrl/Cmd+Enter switched on in the AI settings, pressCmd+Enter(Windows/Linux:Ctrl+Enter).
The AI looks up the symbol, its callers and the specs and projectdocs anchored to it with the tools of Tracemoor. The chat shows each tool call. The answer links to the code: a click on a link opens the file at the line.
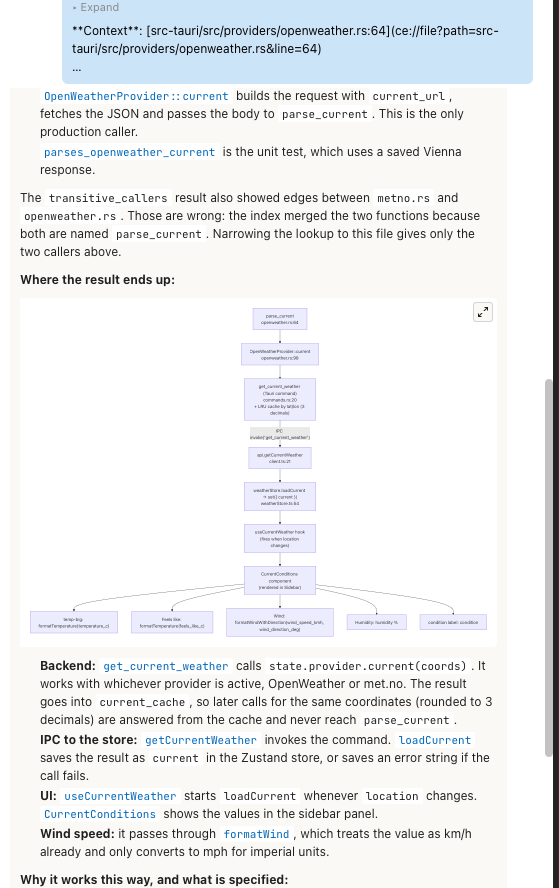
The answer names the callers, follows the result from the backend command to the component that shows it, and draws the path as a diagram.
See How the AI works in Tracemoor and Ask about code.
6. Record what you learned
- Choose View › Dashboard (
Cmd+1, Windows/Linux:Ctrl+1). - In the dashboard toolbar, click Create a new entry in a phase.
- Choose a Phase, the Type
researchand enter a Title, for example "How current weather reaches the sidebar". - Click Create. The entry opens.
- In the entry header, click Edit body in place, write a few sentences
and press
Cmd+S(Windows/Linux:Ctrl+S). - In the Code anchors row, click + anchor.
- Type
parse_currentand click the line foropenweather.rsin the list.
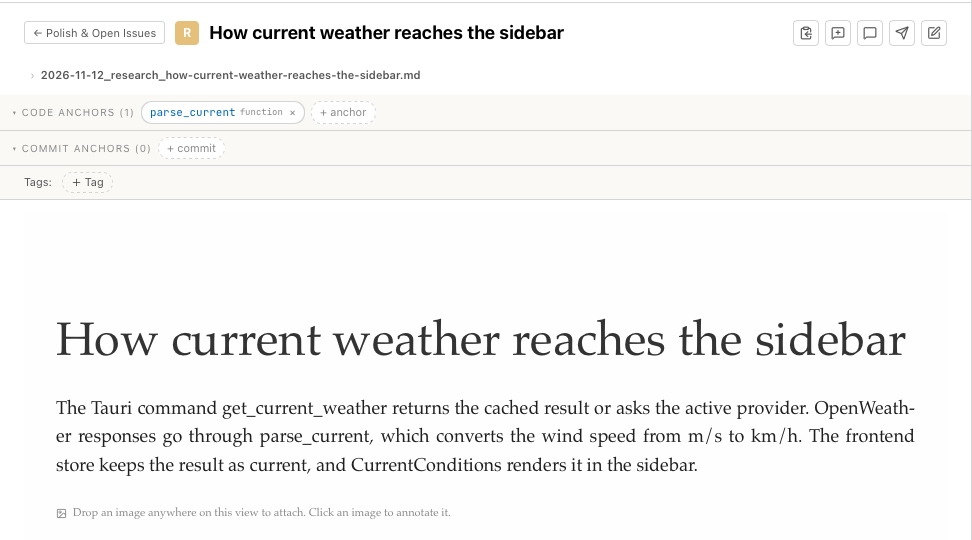
The anchor chip parse_current links the entry to the function.
The entry is a Markdown file in the exploration. See Phases and entries and Anchors.
7. Find the entry from the code
- Choose View › Source View and select
parse_currentagain. - In the gutter next to the function, click the blue mark.
A panel below the line lists every projectdocs entry anchored to the function. Open entry opens it in the dashboard.
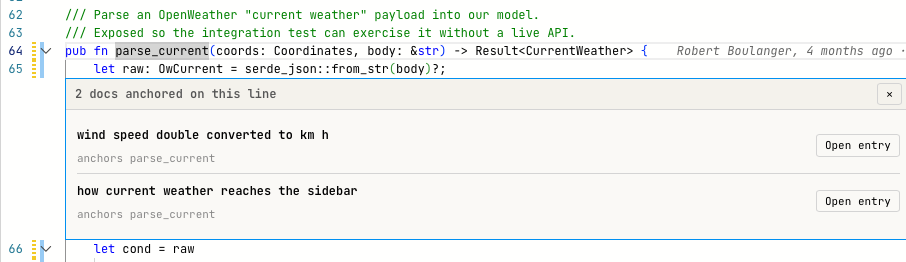
Two entries are anchored to parse_current: an earlier bug report and the new note.
The AI finds the entry the same way: the tool projectdocs_for_symbol
returns the entries anchored to a symbol. See
Gutter and anchors and
projectdocs and the AI.
Next steps
| To | Read |
|---|---|
| Get to know a larger codebase | Find your way in a codebase |
| Write requirements and tests and anchor them | Specifications |
| Commit with changelists | Changelists |
| Let the AI work on a longer task | Longer tasks across sessions |
| Run the program from Tracemoor | Run and build the project |
| See how the parts fit together | Overview |