Graph View
The Graph View draws one perspective of the code graph at a time. It starts empty and fills when you pick a perspective or type a query. The concepts behind it are described in The code graph.
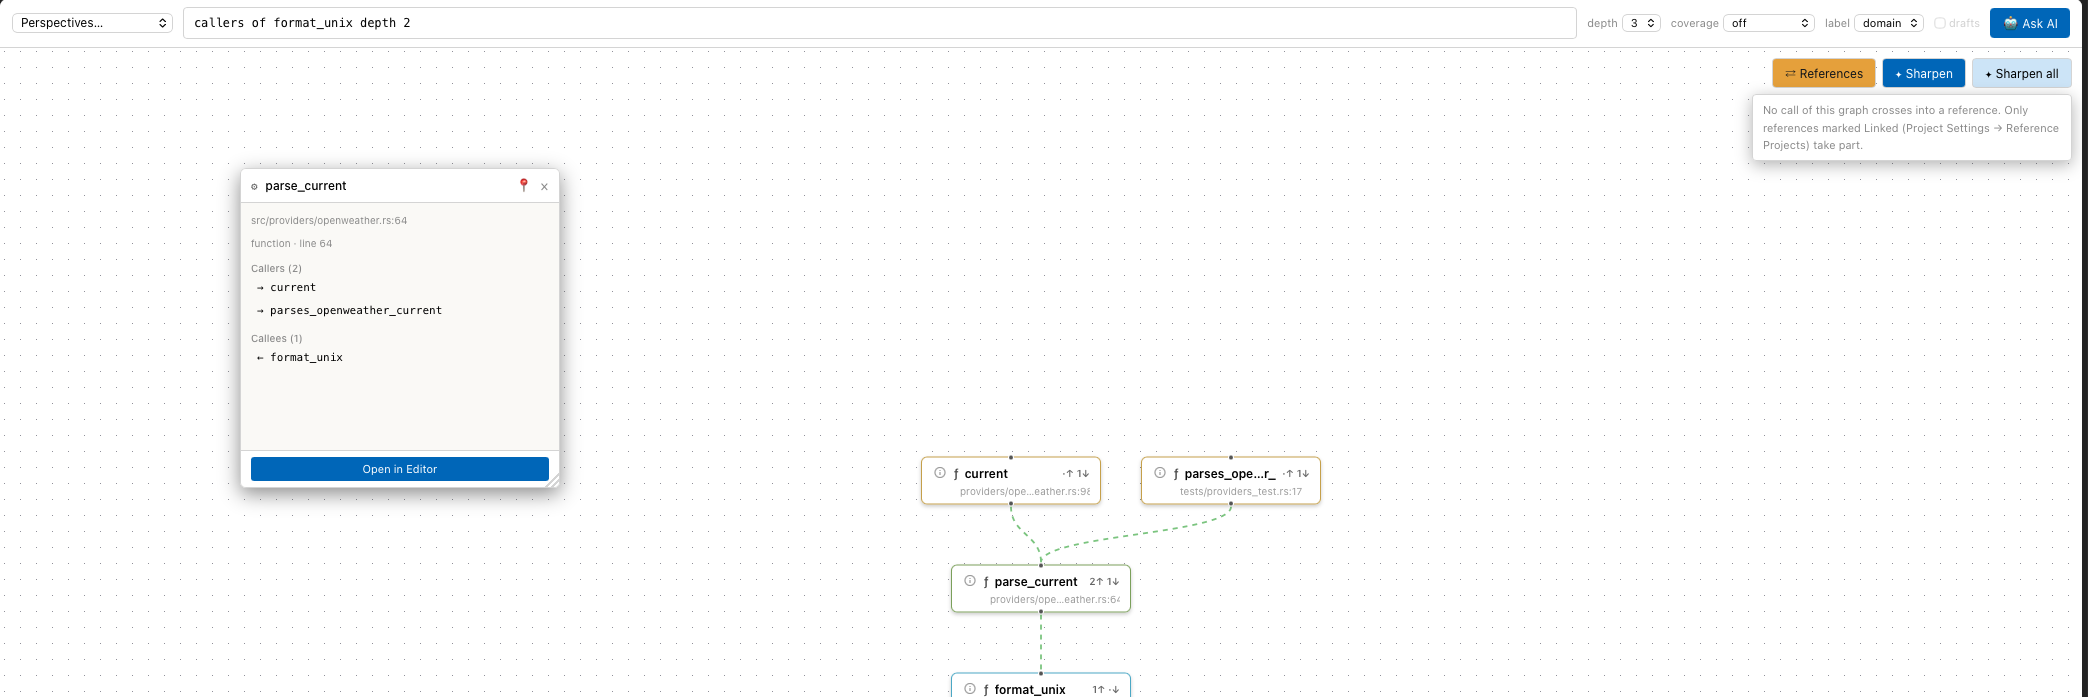
The perspective callers of format_unix depth 2 with the inspector card of parse_current.
Open the Graph View
- View › Graph View (
Cmd+6, Windows/Linux:Ctrl+6) shows the graph alone. - View › Graph + Editor Split (
Cmd+2, Windows/Linux:Ctrl+2) shows the graph left and the editor right. Drag the divider to resize it, double-click the divider to reset it. - A
ce://graph-perspectivelink in a chat answer or a projectdocs entry opens the graph with that perspective. From the code view it opens the split.
Run a perspective
The query bar at the top has two entry points:
- Perspectives… runs a perspective that needs no starting point: Dead Exports, Orphan Files, Circular Dependencies, Complexity Hotspots, Entry Points, Recent Changes, Reactive Graph and Semantic Domains.
- The text field takes a query in plain words, for example
callers of parse_current depth 2orimpact of src/api/client.ts.
To type a query:
- Click the text field.
- Type the start of a query, for example
ca. A list of matching query forms appears. - Press
Tabto take the highlighted form, or use the arrow keys to pick another one. - Complete the symbol or file name and press
Return.

Text that matches no query form runs a full-text search over the source and draws the 20 best matching files, without edges. Perspectives and queries lists every form.
The controls to the right of the text field:
| Control | Effect |
|---|---|
| depth | Number of levels (1–5) for callers, callees and call trees. depth N in a query overrides it. |
| coverage | Colours nodes by spec coverage: off, coverage, trace depth, density. See Colour by spec coverage. |
| label | Second line of each node: path (file and line), domain (semantic domain, falls back to the path), none. Also in View › Tile Label. |
| drafts | With coverage on: count draft and review specs as well as approved ones. |
| 🤖 Ask AI | Opens a dialog for a question in plain language and sends it to the chat panel. The answer links back into the graph. |
Pick one of several symbols
If a query names a symbol that exists more than once, a dialog lists the definitions with their file and line.
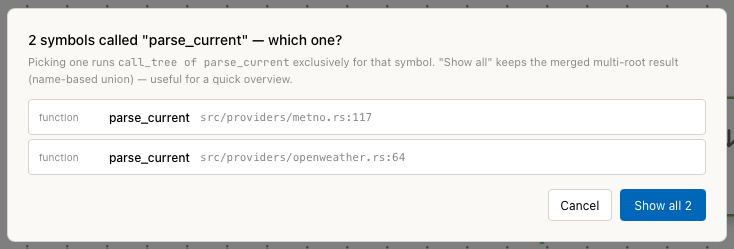
- Click a row to run the perspective for that definition only.
- Show all N draws the merged result for all definitions.
- Cancel draws nothing.
Perspectives started from a node, from the context menu or from a link with
focus_file and focus_line skip the dialog, because the definition is known.
Read a node
A node shows, from left to right: the ⓘ button, an icon for its kind, the
name, and the number of incoming and outgoing edges in the current graph
(2↑ 1↓). The second line depends on label.
| Icon | Kind |
|---|---|
ƒ | function |
⚙ | method |
🔷 | class |
📐 | interface |
⬡ | component |
📄 | file |
▶ | entry point |
🔥 | hotspot |
◌ | orphan file |
♻ | member of an import cycle |
± | changed file |
🗂 | semantic domain |
The border colour shows the distance from the starting node. Hovering a node shows its full name and path.
Work with nodes
| Action | Result |
|---|---|
| Click | Focuses the node: it and everything connected to it stay bright, the rest is dimmed. Click the background to undo it. |
| Click ⓘ | Opens the inspector card of the node. |
| Double-click | Runs the next perspective for the node: call tree for a symbol, impact for a file, the member files for a domain. |
| Right-click | Opens the context menu with the perspectives for this node. |
Nodes from a reference project open their file read-only on double-click or ⓘ.
Context menu
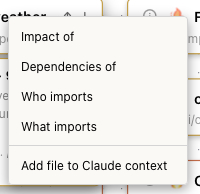
| Node | Entries |
|---|---|
| Symbol | Callers of, Callees of, Call chain, Cross-project call tree, Filter Specs to anchors of this, Add to AI Context |
| File, hotspot, orphan, cycle member, changed file | Impact of, Dependencies of, Who imports, What imports, Add File to AI Context |
| Entry point | both groups |
| Node of a reference project | Open source (read-only), Add to AI Context |
Call chain draws the call tree in the graph. The Call Chain Explorer is a separate view, see Call Chain Explorer. Add to AI Context passes the symbol or file to the running chat session as context for the next question.
Inspector card
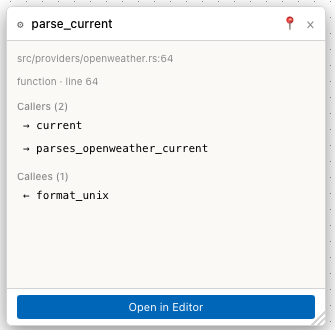
The card of a symbol shows its file, kind and line, its callers and its callees. The card of a file shows its language, line count, its main symbols and its imports.
- Click a caller or callee to focus it in the graph. If it is not in the graph, its callers or callees are drawn.
- Open in Editor opens the file at the symbol and switches to the split.
- Drag the header to move the card. Drag it to the left or right edge to dock it.
- The pin keeps the card open when you open another one. Up to two cards can be pinned.
- × closes the card.
Go back
Each double-click adds a step to the trail under the query bar.

- Click a step to draw it again. Later steps are removed.
- × at the right end clears the trail and the graph.
Zoom and move
- Scroll or pinch to zoom, drag the background to move.
- View › Zoom In Graph (
Cmd+=), View › Zoom Out Graph (Cmd+-). - View › Zoom to Overview (
Cmd+0) fits the graph into the view, at most at 100 %. - The buttons at the bottom left zoom, fit the view and lock the layout. The minimap at the bottom right shows the visible part of a large graph.
A newly drawn graph is fitted into the view. A graph with few nodes is drawn enlarged; use Zoom to Overview to see it at normal size.
Sharpen call edges
Call edges come from the index and can be missing or wrong where calls go through traits, interfaces or same-named functions. ✦ Sharpen asks the language server of the file for the call hierarchy and compares it with the edges on screen.
Prerequisite: a language server for the language of the starting symbol is installed (Analysis › Language Servers…).
- Draw callers, callees or a call tree of a symbol.
- At the top right of the canvas, click ✦ Sharpen to check the edges of the starting symbol, or ✦ Sharpen all to check every visible node of this project.
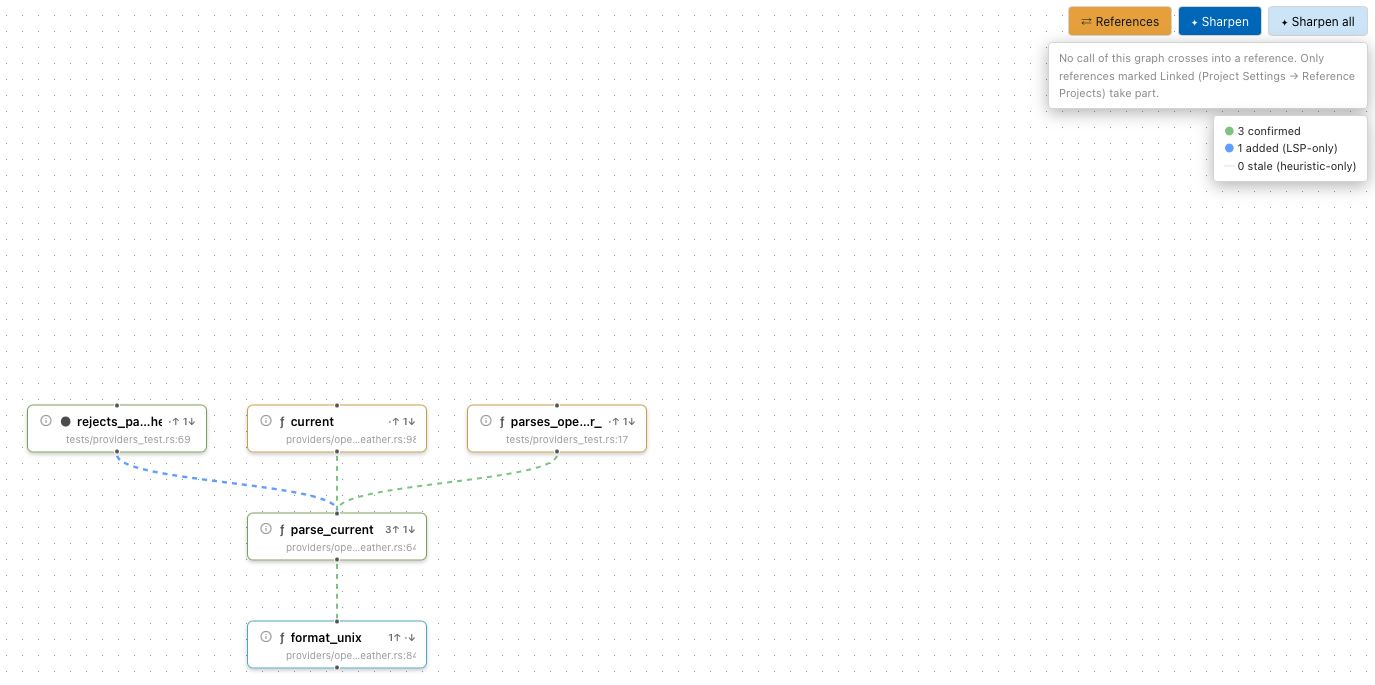
The edges change their style:
| Edge | Meaning |
|---|---|
| green, solid | confirmed: the language server reports the same call |
| blue, animated | added (LSP-only): the server reports a call the index missed. The calling node is added to the graph. |
| orange, dashed, dimmed | stale (heuristic-only): the index has the call, the server does not |
A box under the buttons counts the three kinds. Sharpen changes only the graph on screen, not the index and not the code. Nodes from libraries and reference projects are skipped.
A language server needs time to index the project after it starts. While it does, the result can be empty and is marked provisional — server may still be indexing. Run Sharpen again when the status bar shows the server as ready.
Colour by spec coverage
With specs in the exploration, the graph can colour each node by how well it is specified. Choose a mode in coverage or in the View menu:
| Mode | Menu entry | Colours |
|---|---|---|
| coverage | View › Coverage Heatmap (Auditor), View › Coverage Heatmap (Reviewer) | uncovered, partial, covered, trace complete; suspect anchors as outline |
| trace depth | View › Coverage Trace Depth | how many levels of the profile's trace chain (for example URS › FS › TC) reach the node, from depth 0 to full |
| density | View › Coverage Density | spec anchors per 1000 lines of the node's file, from cold spot (0) to more than 15 |
The auditor heatmap counts approved specs only. The reviewer heatmap and the drafts checkbox count draft and review specs too.
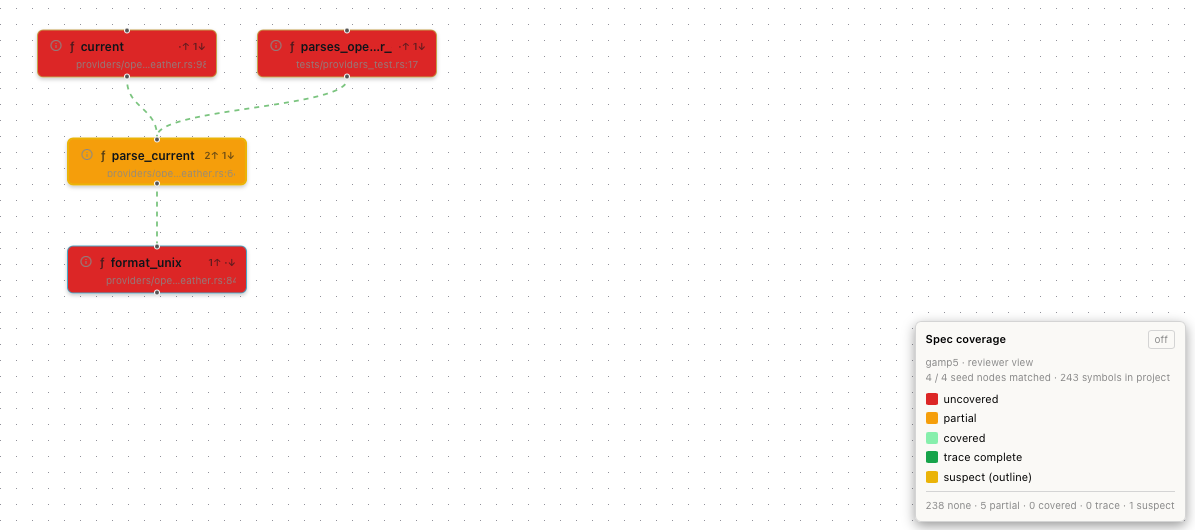
The legend at the bottom right names the active profile, the number of matched nodes and the counts per colour. off in the legend, coverage › off or View › Coverage Overlay Off removes the colours.
Follow calls into other projects
⇄ References at the top right continues callers, callees and call tree into reference projects with the purpose Linked. It has the same effect as View › Show Reference Projects in Graph and stays on until you switch it off. If no call of the current graph leaves the project, a note under the button says so. See Calls between linked projects.
Limits
- The perspectives in Perspectives… have no entries in the menu bar.
- depth goes up to 5. impact of and dependencies of typed as a query use depth 3 unless the query says otherwise; from the context menu they use depth 2.
- A cross-project graph that hits its size limit says Limit reached, graph incomplete. in the box at the top right.
- Show all N in the disambiguation dialog merges the edges of all definitions. The edges of one definition can no longer be told apart.