Call Chain Explorer
The Call Chain Explorer shows one symbol with its direct callers and callees, each with the lines of code where the call happens. You follow a call by making a caller or callee the new focus. The graph shows the shape of many calls at once; the Call Chain Explorer shows the code of one step at a time.
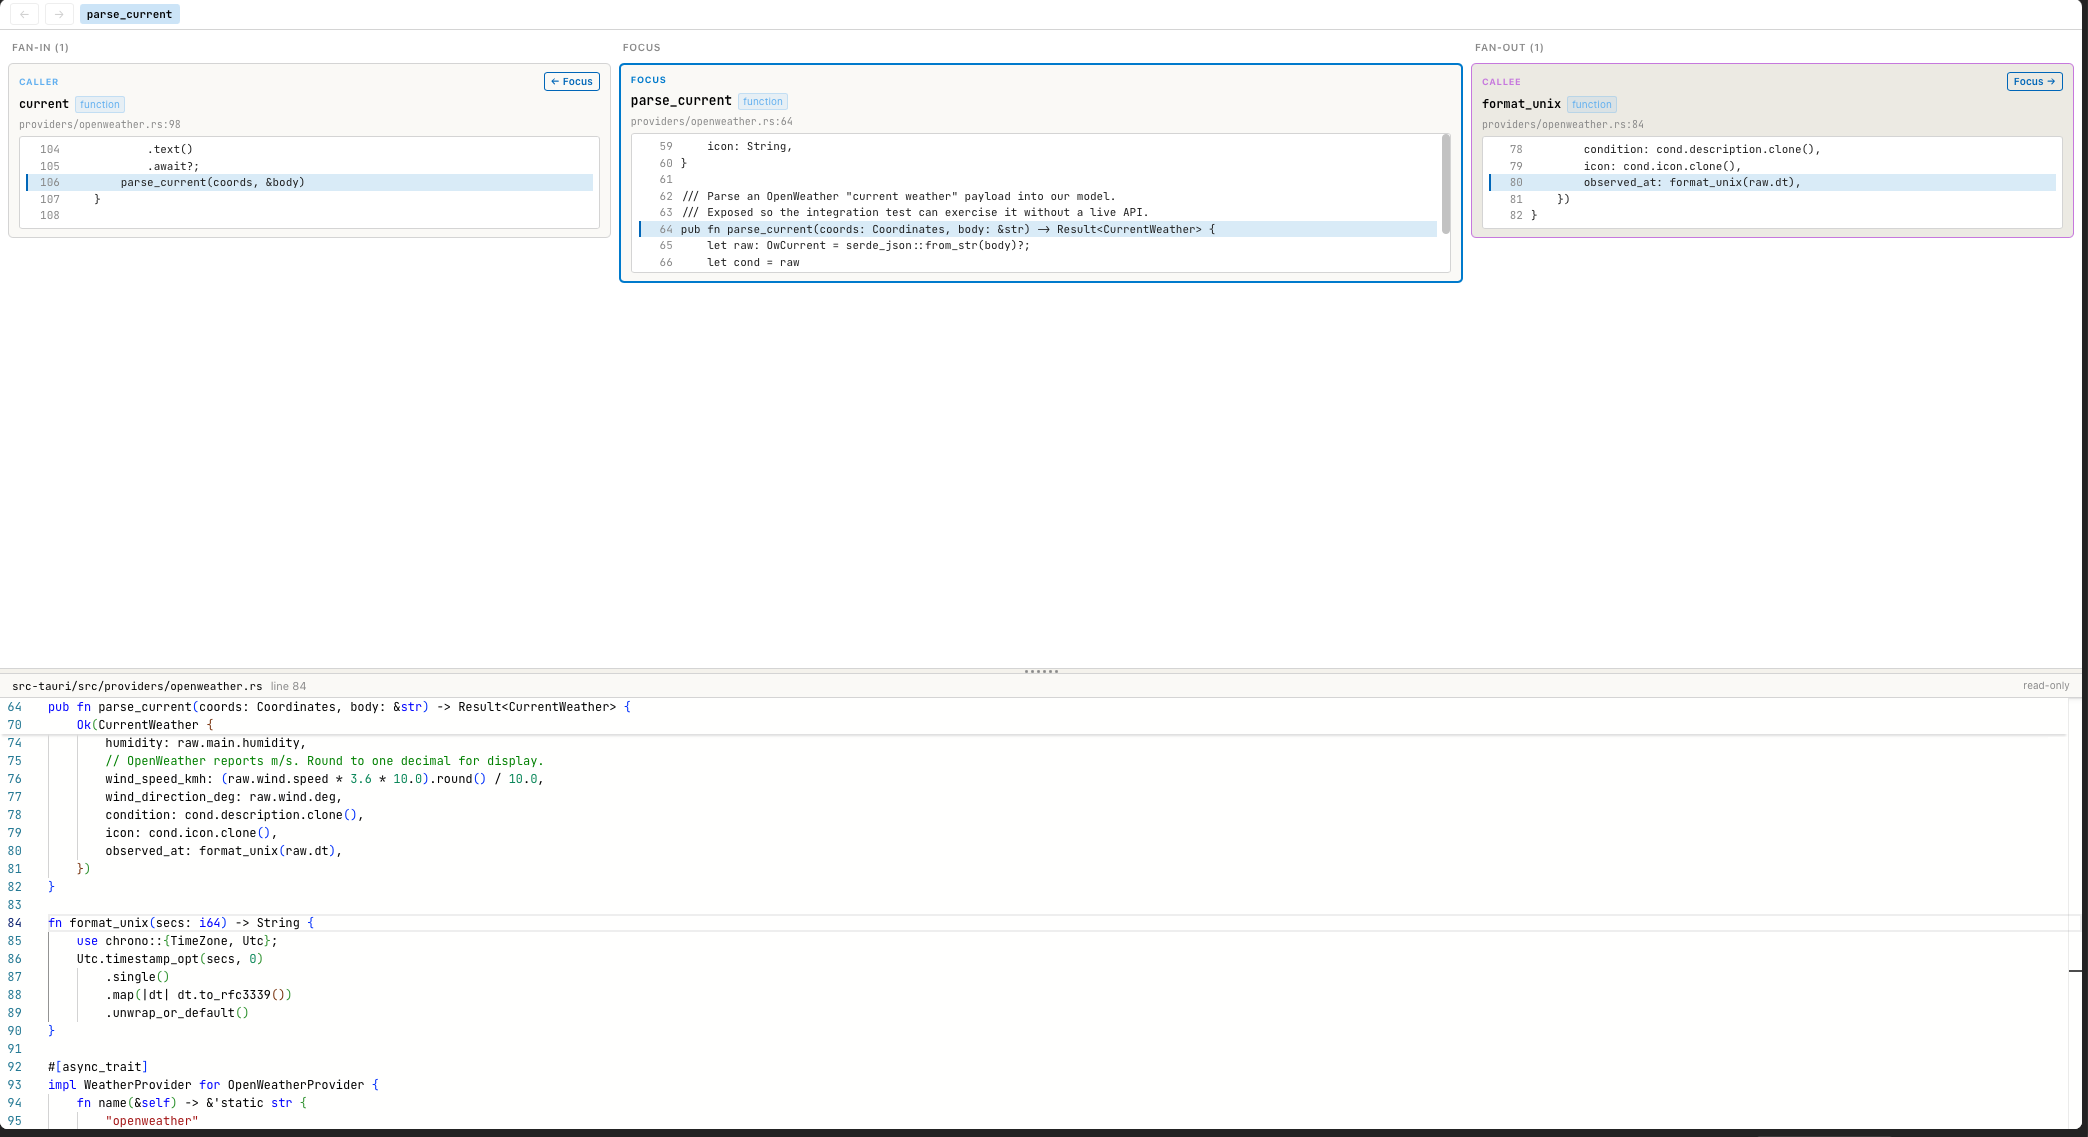
parse_current in focus: its caller current on the left, its callee format_unix on the right, the file of the clicked card below.
Open the Call Chain Explorer
View › Call Chain Explorer (Cmd+5, Windows/Linux: Ctrl+5) switches to
the view. To load a symbol, use one of these:
- In the editor, right-click inside a function and choose Explore call chain. The explorer focuses the declaration at or above the cursor.
- In the details panel next to the editor, click the N callers → or N callees → button, or Explore call chain → for a symbol without calls.
- In global search (
Cmd+P, Windows/Linux:Ctrl+P), click → chain on a symbol, or select it and pressShift+Return. - Click a
ce://call-chain?file=…&name=…&line=…link in a chat answer.
The entry Call chain in the context menu of a graph node draws the call tree in the graph, not in this view. See Graph View.
Read the board
The upper half has three columns:
| Column | Cards |
|---|---|
| Fan-in (N) | Symbols that call the focus. Each card shows the call site in the caller's file. |
| Focus | The focus symbol with the start of its body. |
| Fan-out (N) | Symbols the focus calls. Each card shows the call site in the focus file. |
Markers on a card:
| Marker | Meaning |
|---|---|
| ENTRY | The caller is an entry point of the project. |
×3 | The symbol calls or is called at three places. Click it to list the other call sites; click one to show it in the preview. |
| red border | The symbol is already part of the chain. Following it would loop. |
| coloured chip with a project name | The symbol belongs to a reference project and opens read-only. |
⇄ GET /forecast, ↳ implemented by | The call crosses into a linked project or into an implementation of an interface. See Calls between linked projects. |
Calls to libraries and the standard library have no card.
Follow the chain
- On a caller card, click ← Focus. On a callee card, click Focus →. The card becomes the focus and its own callers and callees load.
- Repeat until you reach the code you are looking for.
The bar at the top lists each focus you visited. Click a name to go back to it.
The arrow buttons go back and forward, as do Cmd+[ and Cmd+]
(Windows/Linux: Ctrl+[, Ctrl+]).
Preview the source
The lower half shows a read-only editor. Click a card to fill it:
- a caller card shows the call site in the caller's file,
- a callee card shows the declaration of the callee,
- the focus card shows the declaration of the focus.
The header names the file and line. Drag the bar between the halves to change their sizes. To edit the file, open it from the file tree or the graph.
Ask the assistant about a card
Right-click a card to open the Ask AI dialog. Its title names the role and the symbol, for example "Ask AI — Caller: parse_current". Prompt preview shows the context that goes along with the question: the role, a link to the symbol, its file and line.
- Type the question under Your question.
- Click Ask (
Cmd+Return, Windows/Linux:Ctrl+Return). The prompt goes to the chat panel.
Esc or Cancel closes the dialog.
Limits
- The explorer shows one level in each direction. For several levels at once, use callers of, callees of or call chain of in the Graph View.
- The explorer follows the resolved call edges of the analysis. The graph perspectives also match calls by name, so they can list callers the explorer does not show, for example a test that calls the function through its module path.
- The view has no menu entries for back and forward.