Coverage
Coverage shows how much of the code is specified. For each code symbol it counts the anchors of each artifact type that point to it. Links between specs do not count, see Two views on the same data.
Which symbols count
Coverage counts symbols that carry behaviour: functions, methods, classes and components. Constants, variables, type declarations, interfaces, re-exports and test code are not counted, also when they carry anchors. In the Weatherreport demo this leaves 153 of 243 symbols.
An anchor counts when it resolves (ok) and its spec has a counting status.
The reviewer checkbox in the Specs view toolbar switches between the two
views:
| View | Counts specs with status |
|---|---|
| Auditor (checkbox off) | approved |
| Reviewer (checkbox on) | draft, review, approved |
Each symbol gets one of these states:
| State | Meaning |
|---|---|
| uncovered | No counting anchor. |
| partial | Counting anchors, but not of every type in the trace chain. |
| covered | Anchors of every type in the chain, at least one of them suspect. |
| trace complete | Anchors of every type in the chain, none suspect. |
Read the coverage tile
The toolbar of the Specs view shows the coverage of the project, for example
3.3 % anchored · 5/153 · strict 0.7 %.
| Part | Meaning |
|---|---|
anchored | Share of symbols with at least one counting anchor. |
5/153 | Anchored symbols of all symbols that count. |
strict | Share of symbols that are covered or trace complete. |
URS FS TC | Share of symbols with at least one anchor of this type. |
| ⚠ N suspect | Symbols with a suspect counting anchor. A click opens the gap list with the suspect filter. |
A click on the tile opens Coverage Drill-Down:
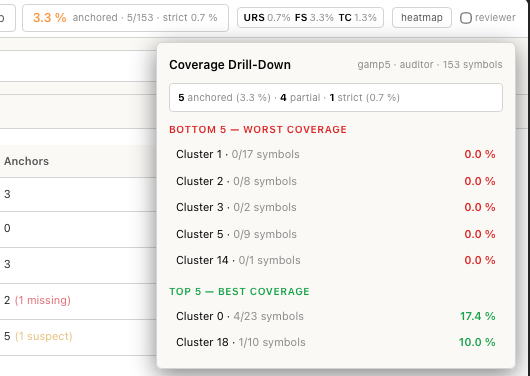
The first line repeats the counts, with the number of partial symbols.
Bottom 5 — worst coverage and Top 5 — best coverage list clusters of
the graph with their share of anchored symbols. A click
on a cluster opens the Graph view with the coverage colouring and limits the
spec list to the specs anchored in that cluster.
List the gaps
- In the Specs view toolbar, click Gaps, or choose View › Coverage Gaps.
- Choose a filter.
- Optional: in the scope menu choose
cluster,fileormoduleand enter the cluster ID, the file path or a path prefix. - Click a symbol to open it in the code view.
| Filter | Lists |
|---|---|
uncovered | Symbols without a counting anchor. |
partial | Symbols with anchors, but not of every chain type. |
no test | Symbols with anchors, but none of the last chain type (TC). |
suspect | Symbols with a suspect counting anchor. |
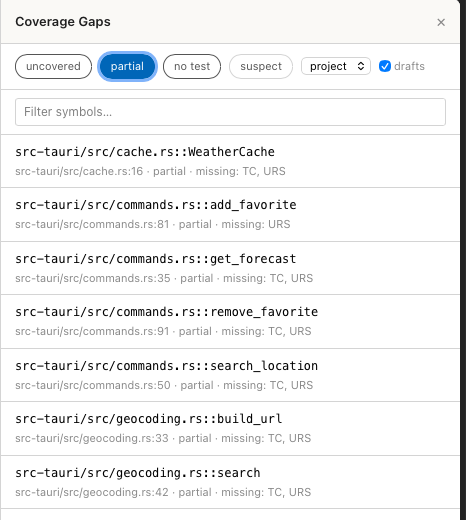
Each row shows the symbol, its file and line, the state and the types that
are missing, for example missing: TC, URS. The drafts checkbox switches
the list to the reviewer view and is on by default. Filter symbols…
narrows the list by text. The list shows at most 200 symbols, the most
severe first.
Colour the graph
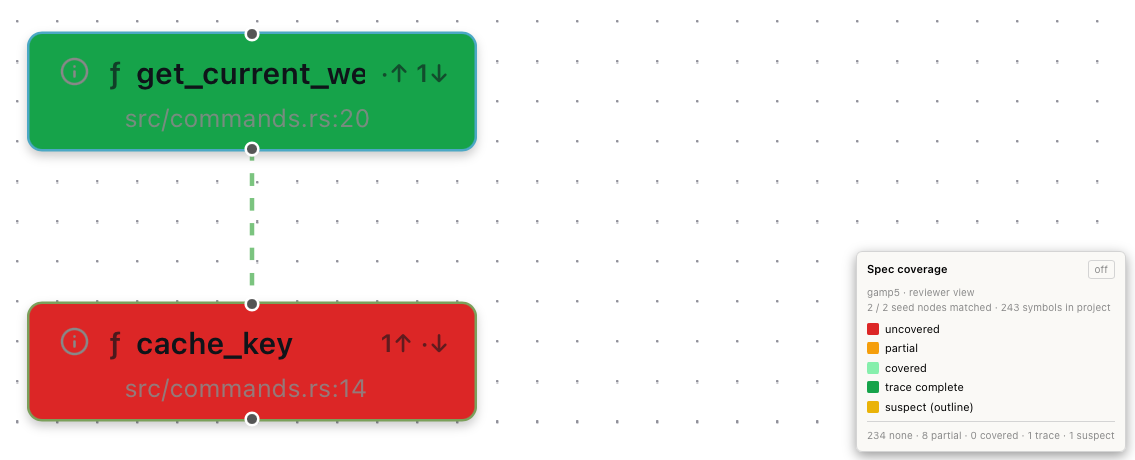
The Graph view can colour symbol nodes by their spec coverage. The colouring
applies to the graph that is shown, so first open a graph, for example with
the query callees of get_current_weather depth 2.
| Menu entry | Colouring | Counts |
|---|---|---|
| View › Coverage Heatmap (Auditor) | by state | approved |
| View › Coverage Heatmap (Reviewer) | by state | draft, review, approved |
| View › Coverage Trace Depth | by number of chain types covered | draft, review, approved |
| View › Coverage Density | by anchors per 1000 lines of the file | draft, review, approved |
| View › Coverage Overlay Off | none | – |
The heatmap button in the Specs view toolbar opens the Graph view with the colouring by state. In the Graph view toolbar, the coverage menu chooses the colouring and the drafts checkbox switches between auditor and reviewer view.
The legend in the lower right corner names the profile and the view, counts the nodes per state and has an off button.
| Colouring | Legend |
|---|---|
| State | red uncovered, orange partial, light green covered, green trace complete, yellow outline suspect |
| Trace depth | grey depth 0, blue depth 1, teal depth 2, green full chain |
| Density | red cold spot (0 per 1000 lines), orange up to 2, yellow 2 to 5, light green 5 to 15, green above 15 |
Density is computed per file. A large file with a single anchor shows as a cold spot even though one of its symbols is covered.
Close the gaps
- Open Coverage Drill-Down and pick a cluster from Bottom 5 — worst coverage.
- Open Gaps, set the scope to
clusterwith that cluster ID and the filter touncovered. - Write specs for the important symbols, by hand or generated from the code. See Write and maintain specs and Generate specs from code.
- Switch the reviewer checkbox on to see the effect of the new specs
while they are still in
draftorreview.
Generated drafts in specs/_drafts/ do not count in either view until they
are accepted.