Web inspector
The web inspector connects Tracemoor to your Chrome through the Chrome DevTools Protocol. In a connected tab you can pick an element, trace what one click on it runs, take a screenshot and record network and console events. Each result is attached to the chat as context for a question.
The inspector works with Google Chrome 144 or newer. Other browsers are not supported.
Connect
- Start your web application, for example its dev server.
- Choose Analysis › Connect Browser… or click Connect Browser… (plug icon) in the toolbar.
- Under Target URL (optional), enter the address of the application, for
example
http://localhost:1420. The address is saved per exploration. - Click Connect. Chrome opens
chrome://inspect. - On that page, turn on Remote debugging.
- Confirm Chrome's permission dialog with Allow.
Chrome shows the banner "Chrome is being controlled by automated test software". Bridge Status changes to Connected, and the target URL opens in a new tab.
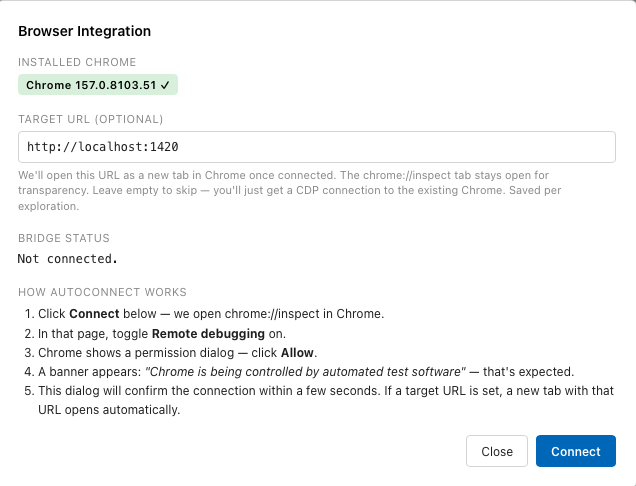
Installed Chrome shows the version found. With a version older than 144, Connect stays disabled.
The inspector connects to the Chrome you use every day, with your profile and your open tabs. Picking, tracing, screenshots and recordings work in the tab that it opened for the target URL. Without a target URL these commands fail with "No active target tab. Connect with a Target URL to enable this."
One browser connection exists per Tracemoor instance. If another project window holds it, disconnect there first.
Pick an element
- In the dialog, click 🎯 Pick Element.
- In Chrome, move the pointer over the page. The element under the pointer is outlined.
- Click the element.
Escapecancels.
Picked Element shows the tag, the component name if one was found, the CSS selector and the beginning of the element's text. Then:
- Send to Chat attaches the element to the chat input.
- 🎬 Trace Click traces a click on it, see below.
- Dismiss discards it.
The component name comes from the running page, not from the index:
| Framework | Source of the name |
|---|---|
| React | Name of the nearest component in the React tree. |
| JSX with source annotations | File and line, for example <SearchBar.tsx:42>. |
| Svelte | File and line from Svelte's development metadata, if present. |
Without one of these, only tag and selector are shown. The AI can then find the source through the element's text, see Find the code behind a label.
Trace a click
- Pick the element.
- Click 🎬 Trace Click. A countdown of 15 seconds starts, and the Chrome tab comes to the front.
- Click the same element in Chrome.
The page pauses for a moment while the inspector reads the call stack, then continues. The trace is attached to the chat. It contains:
- up to 10 stack frames of the click handler, with function, file and line,
- the asynchronous frames that led to the handler,
- per frame up to 30 variables from the local, closure, block and catch scopes, each value shortened to 160 characters.
Global and module scope are not read. On a password field the inspector refuses the trace before it reads anything. Without a click within 15 seconds the trace ends with a timeout.
File and line refer to the script Chrome loaded. A dev server delivers code close to the source. A minified production bundle gives positions inside the bundle.
Record runtime events
- Choose what to capture in addition to network and console events:
- Capture DOM mutations. In single-page applications this can produce many events.
- Capture response bodies. Only JSON responses up to 4 KB.
- Click 🔴 Start Recording, or press
Cmd+Shift+E(Windows/Linux:Ctrl+Shift+E). - Use the application in Chrome.
- Click ⏹ Stop Recording.
- Click ➤ Send Recording to Chat to attach the events as a Markdown block, or Clear to discard them.
The counter under Runtime Recording shows the number of events. The buffer is limited. When it is full, the oldest events are dropped, and the counter shows how many.
Other commands
These commands are also in the Analysis menu and in the toolbar while a browser is connected:
| Command | Effect |
|---|---|
| Browser Screenshot → Chat | Attaches an image of the visible area of the tab to the chat. |
| Pick Browser Element → Chat | Starts the element picker. |
| Start Runtime Recording, Stop Runtime Recording, Send Recording to Chat | As in the dialog. |
| Disconnect Browser | Ends the connection. The toolbar button shows the same command while connected. |
Limits
- The inspector does not step through code and does not set breakpoints of its own. Use the DevTools of Chrome or your IDE for that.
- A traced click runs the real handler. A click on "Delete" deletes.
- For a project detected only as a VS Code extension, Connect Browser… opens the VS Code inspector instead. An extension with its own web frontend asks which one to inspect.