VS Code inspector
The VS Code inspector starts a separate VS Code window with the extension of your project, connects to its extension host and shows what runs there. It lists the registered commands, triggers them, and collects console output and exceptions. The collected events can be sent to the chat.
Prerequisites: the project is detected as a VS Code extension, and the code
command of VS Code is on your PATH (in VS Code: Shell Command: Install
'code' command in PATH).
Start the inspector
- Choose Analysis › Inspect VS Code Extension…, or click Inspect VSCode Extension… (Run & Debug Extension Host) in the toolbar.
- In the dialog Inspect VSCode Extension, set the options (see below).
- Click Launch & Inspect.
VS Code opens a new window, and the dialog changes to the connected view within a few seconds.
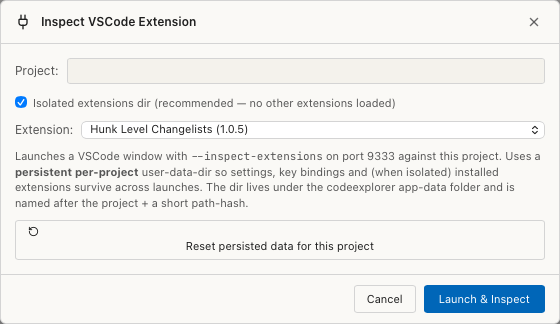
| Option | Effect |
|---|---|
| Isolated extensions dir | The window loads only the built-in extensions, the project's extension and the companion extension. Turn it off to also load the extensions you installed in VS Code. |
| Load all N extensions via F5 | Shown when the project contains more than one extension. Starts the Extension Development Host as with F5 in VS Code, with all extensions of the project, so dependencies between them resolve. |
| Extension: | Without F5 mode: the extension that is loaded from source. Don't load any (open folder only) opens the folder without activating a project extension. |
| Reset persisted data for this project | Deletes the settings, key bindings and installed extensions of the inspector's VS Code profile for this project. |
The window uses its own VS Code profile per project, stored in the app data folder of Tracemoor. Your normal VS Code settings and extensions are not touched. Workspace Trust is off in this window, so the extension activates without a prompt.
The companion extension
Tracemoor installs its companion extension Tracemoor Bridge
(ce-bridge) into the inspector's VS Code profile. Nothing is added to your
project or to your normal VS Code. A newer version of Tracemoor replaces
the companion on the next launch.
The companion reports the registered commands, runs triggered commands and forwards events. In the VS Code window, View › Output with the channel Tracemoor Bridge shows its log.
Read the connected view
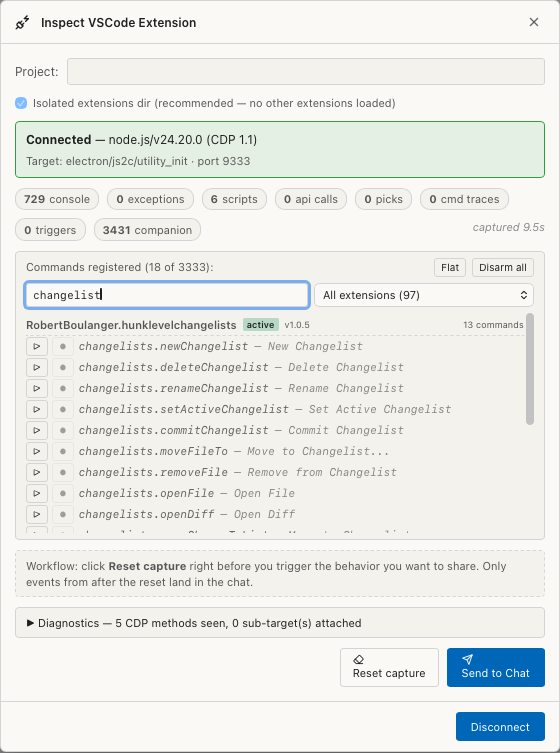
- The green banner shows the connection and the port.
- The counters show what was collected since the last reset: console, exceptions, scripts, api calls, picks, cmd traces, triggers, companion events, and dropped events if the buffer overflowed. captured shows the length of the capture.
- Commands registered lists the commands, grouped by extension. Filter with Filter (id, title, ext)… or the extension dropdown. Flat shows one list without groups.
Each command row has two buttons:
| Button | Effect |
|---|---|
| ▷ | Runs the command through the companion. Arguments, duration and result or error are recorded. |
| ⏺ | Arms a trace for the next call of the command, however it is called. Only for commands the companion saw being registered. Commands it found after activation show the button disabled. |
Disarm all removes all armed traces.
When an extension shows a webview that the companion instruments, a strip with its panels appears. Picking there works like picking in the web inspector.
Send one action to the chat
- Prepare the action you want to examine.
- Click Reset capture. The counters go to zero.
- Run the action: with ▷, or in the VS Code window by menu, shortcut or click.
- Click Send to Chat.
The commands, console output, exceptions and traces since the reset are attached to the chat as Markdown.
Disconnect ends the connection. The VS Code window stays open; close it there when you no longer need it. The profile of the window is kept for the next launch.
Limits
- The inspector cannot record the
vscode.*API calls of other extensions. VS Code protects its API object against replacement. Triggering commands, armed traces and console output remain. - VS Code routes
consoleoutput of extensions past the debugger. The inspector reads it from the log files of the VS Code profile, every 1.5 seconds. Output can arrive with that delay. - Breakpoints and stepping are not available. Use the debugger of VS Code.